
Spectral effects in capacity tests: Choose your model wisely
A case study presented at PVPMC 2026 shows that spectral treatment alone can shift capacity test outcomes by over 3 percentage points — on a test with a 97% pass threshold. That swing was driven entirely by the choice of spectral correction method, not by the plant's actual performance.
· Ben Sudbury · research · 5 min read
A capacity test sits between a solar plant and its commercial sign-off. For an EPC contractor, a failed test isn’t just a technical setback — it can trigger performance liquidated damages that typically run to 10–15% of the contract price. Get the modelling wrong, and a well-performing plant can fail — not because of anything in the field, but because of an overlooked modelling assumption. One of the easiest to miss is spectral mismatch.
What a capacity test actually measures
A capacity test compares what a plant actually produces against what a model says it should produce. That ratio — actual output divided by modelled output — has to clear a threshold, typically somewhere between 95% and 98%, before the plant is signed off.
Get the model wrong, and a well-performing plant may not pass.
Most teams know this for soiling, shading, and degradation. Fewer have stress-tested it for spectrum.
The blind spot in conventional spectral correction
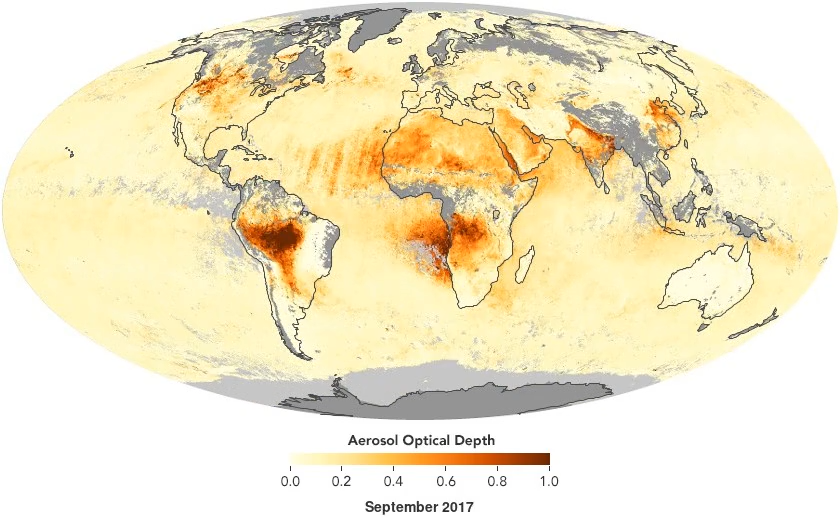
A conventional capacity test model calculates what the plant should have produced, then applies a spectral correction factor to account for the fact that real atmospheric conditions differ from the AM1.5g standard. For CdTe plants, that correction is typically handled by switching on the First Solar model in PVsyst. The problem is that this model’s default coefficients were derived under specific conditions — including very low and constant aerosol optical depth — that may differ significantly from those at your site.
For c-Si plants, the common practice is to skip spectral correction altogether. That assumption is harder to justify than most teams realise — our own published research found that for c-Si systems, the spectral correction factor varies by ±2–3% due to daily and seasonal effects alone. Whether you’re running a CdTe or silicon plant, the spectral correction approach you choose — or choose to ignore — could be quietly working against you.
A real plant. A real problem.
In collaboration with Kiewit — one of North America’s largest EPCs — PV Lighthouse studied a 25-day capacity test on a large monofacial CdTe plant on single-axis trackers in the US Midwest.
The site experienced high aerosol variability and wide swings in water vapour — conditions that push any spectral model hard. Across six different approaches to spectral correction, the implied capacity-test ratio varied by over 3 percentage points.
A 3% swing. On a test with a 97% pass threshold.
The choice of spectral correction method alone drove that swing — not the plant’s actual performance.
The conventional approach underperformed
The standard industry practice for CdTe plants is to apply the First Solar spectral model in PVsyst. In this case study, that approach moved the capacity-test ratio in the wrong direction.
Why? Two reasons. The First Solar model assumes aerosol optical depth is very low and constant — and this site had moderate to high aerosol variability during the capacity test period. And the model’s default coefficients were derived under conditions that differed significantly from this plant’s configuration. Together, those two factors produced a correction that didn’t match the conditions at this site.
This isn’t a flaw unique to one tool. It’s a limitation of approaches that apply a simplified parameterisation derived under fixed conditions, rather than accounting for the conditions at your site.
What changes when you model the spectrum in more detail
An alternative approach combines a detailed spectral model — solved at every timestep using site-specific atmospheric conditions — with forward ray tracing of both direct and diffuse light through the system geometry. Rather than applying a simplified parameterisation derived under fixed conditions, it calculates how the spectrum at your site interacts with the configuration of your plant.
In this case study, this approach agreed more closely with the reference module measurements than the conventional method — though all approaches, including the measurements themselves, carry their own sources of uncertainty.
Our case study tested six approaches
Our case study tested six approaches to spectral correction. The results varied significantly — and the conventional approach did not come out well. Keith will describe the approaches, why they differ, and how best to address spectral mismatch at PVPMC. With our collaborators, Kiewit Engineering, we’ll also present more spectral data and analysis at IEEE PVSC in June 2026.
See the full analysis at PVPMC 2026
If you’re involved in capacity testing or performance guarantees, this presentation is worth your time. The case study focuses on CdTe — but if you’re asking whether silicon plants face similar risks, that question is worth exploring too.
Keith McIntosh from PV Lighthouse will present the findings in Session 6 (9 am, Wed 13 May) at the 2026 PVPMC Workshop. He’ll also cover spectral effects in depth in a tutorial session (4:20 pm, Thu 14 May).
Whether you’re joining us at PVPMC or reading this after the fact, we’d be happy to share the full results and discuss how spectral effects might apply to your projects. Get in touch with the team at PV Lighthouse.
This project received funding from the Australian Renewable Energy Agency (ARENA) as part of ARENA’s Advancing Renewables Program. The views expressed herein are not necessarily the views of the Australian Government, and the Australian Government does not accept responsibility for any information or advice contained herein.